Cube Tidy: Sort & Fill
 Marble Away!
 Arrows Lace Puzzle
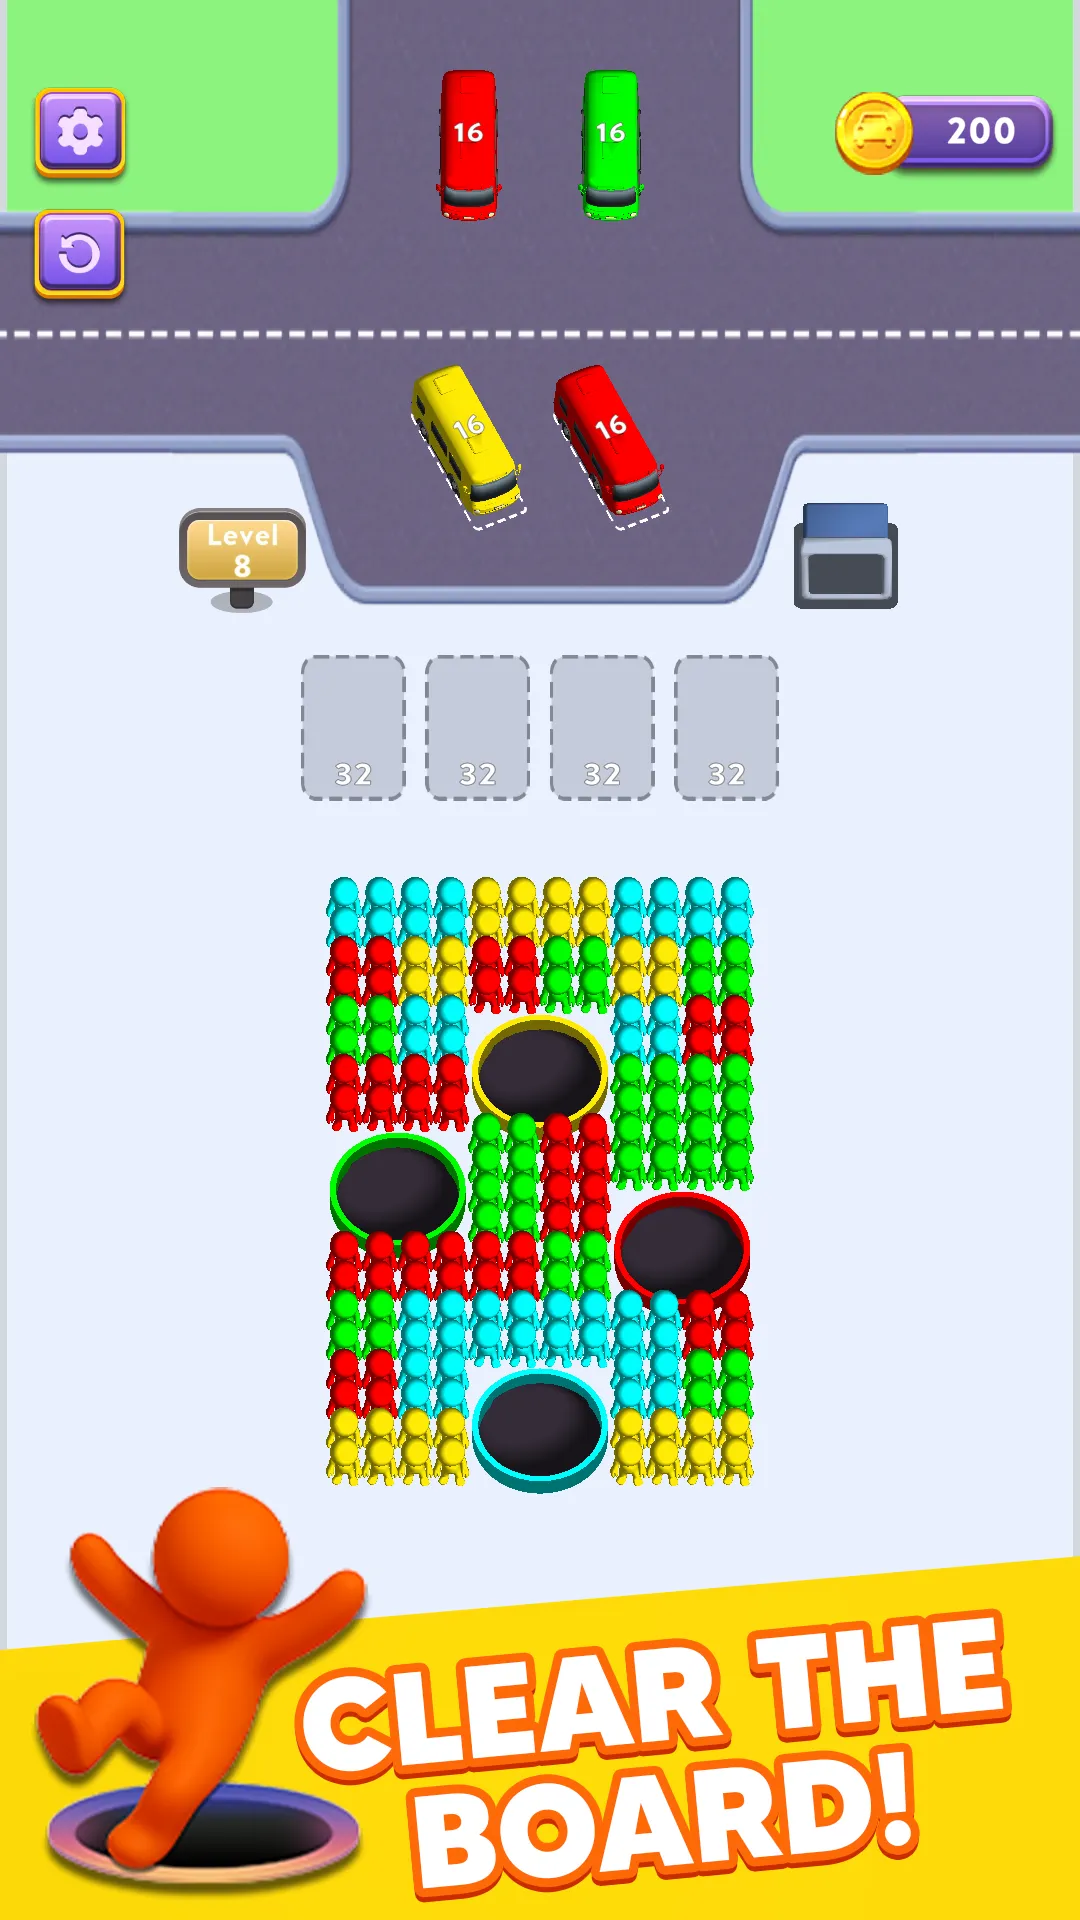
 Hole Crowd: Bus Jam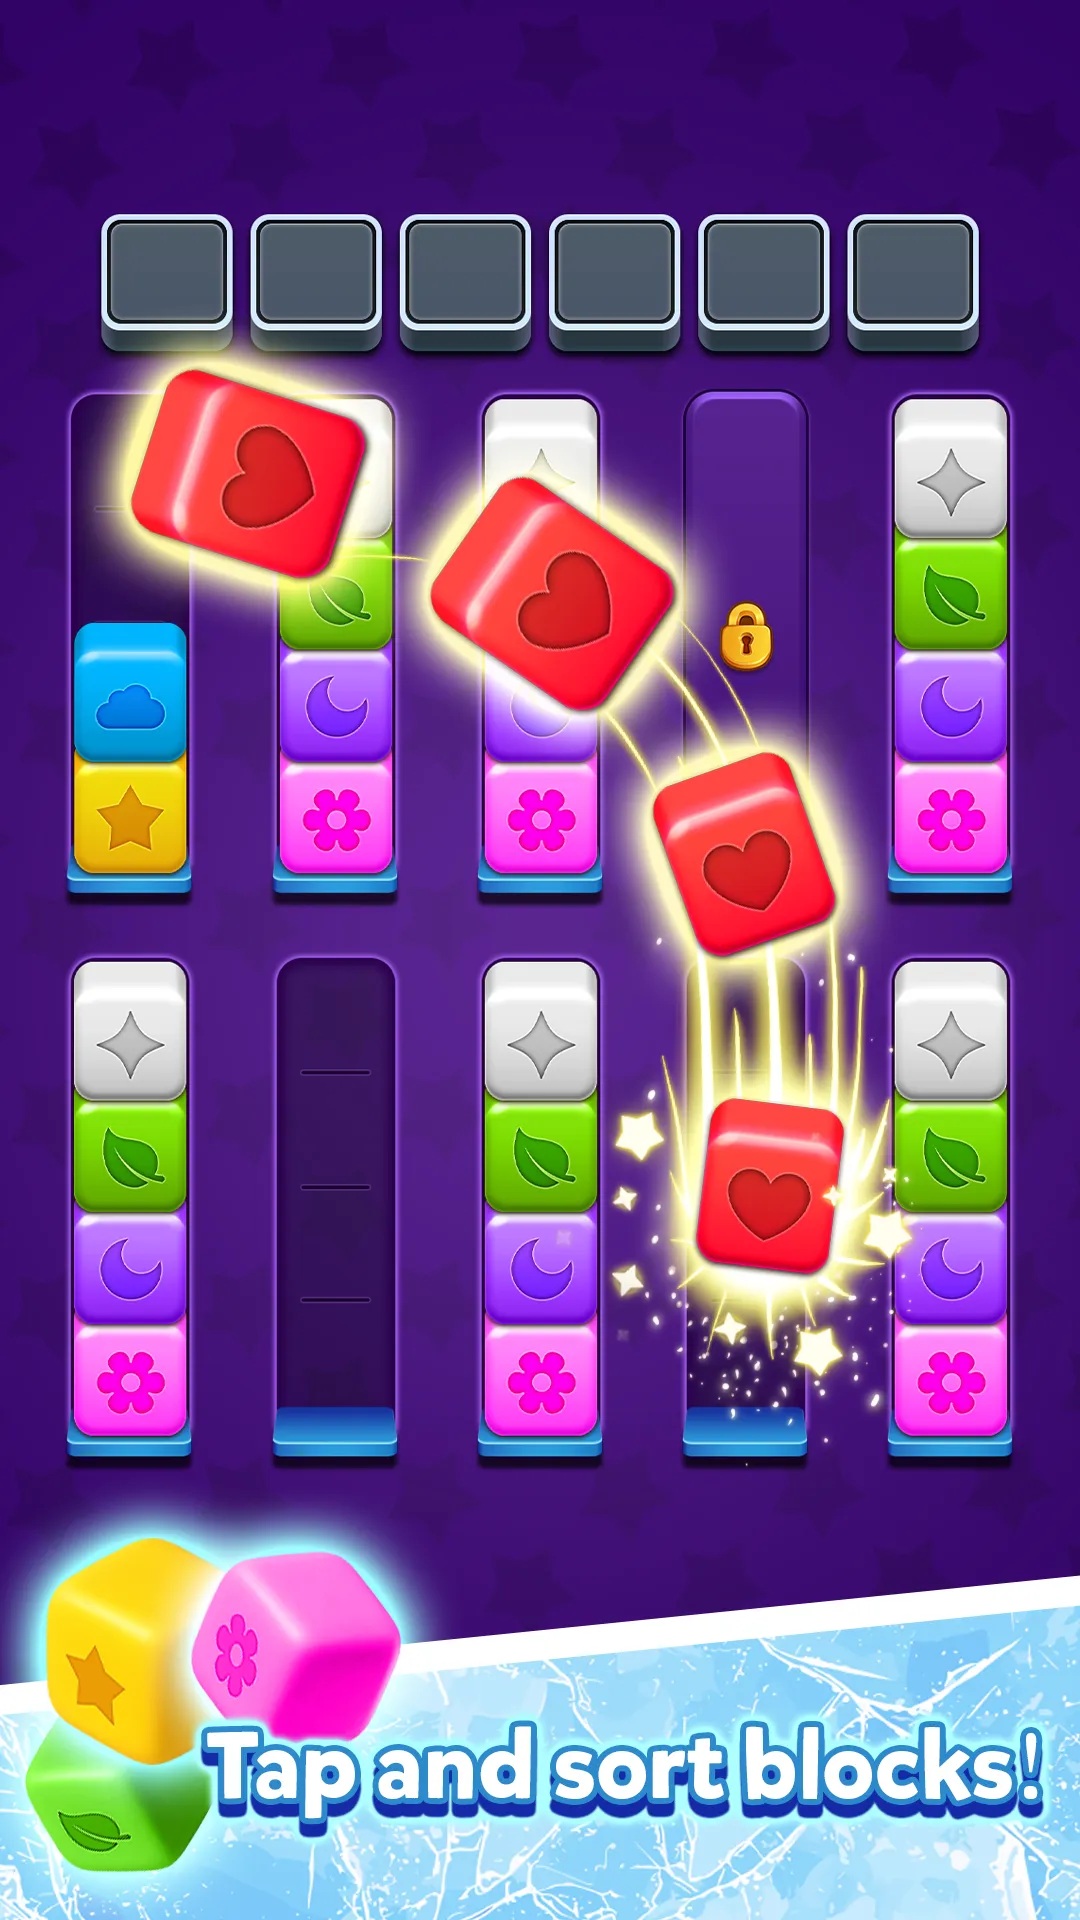

Cube Tidy: Sort & Fill
Sort Puzzle
Move and sort colored blocks to complete the tower layer by layer — a tidy, satisfying block-sort puzzle.
LiveAndroid
View gameWhy generic dashboards were not enough for a studio test-launching a title every few weeks, and how a purpose-built BI system changed which games get more investment.
Published May 20, 2026
Games in this case study
Off-the-shelf analytics answered marketing questions — installs, sessions, revenue — but not the questions that decide a puzzle game's fate: where exactly do players stall, is the economy leaking, which cohorts justify more UA spend?
With more than a dozen titles live at once, the team needed one place to compare games on the same definitions, and it needed the numbers early enough to stop investing in the wrong one.
One event taxonomy shared by every game on the framework.
Retention by cohort (D1, D3, D7, D14, D30) with segment filters.
Level-by-level funnels: attempts, fails, completion time, booster use, drop-off.
Ad and IAP performance by placement and product, and the in-game economy's sources and sinks.
Near real-time visibility so go / kill decisions can be made within days of a test launch.
Instrument the framework, not each game. Level, economy, ad and IAP events are emitted automatically by shared systems, so a new title is fully tracked on day one.
Build dashboards around decisions: each screen exists to answer a specific question a producer asks weekly.
Keep definitions strict and documented, so a 'D7' or a 'level fail' means the same thing in every title and every conversation with partners.
A Unity client SDK batches events with offline buffering and sends them to a backend on Google Cloud, with Firebase as the identity and remote-config layer.
The web dashboard (report.cmzsoft.com) covers engagement, retention cohorts, level funnels, advertising (impressions, eCPM, fill rate, revenue by placement), IAP conversion and revenue per payer, currency flows and player segments.
Remote configuration is connected to the same data, so difficulty, booster and event parameters can be changed and measured without an app release.
Every game on the framework has had cohort retention, level funnels and monetization dashboards from its first test build.
Level design reviews are now driven by funnel data — designers receive a list of levels with abnormal fail or drop-off rates instead of guessing.
Go / kill conversations happen on shared numbers with agreed definitions, and the KPI targets in GD Studio are the same ones the dashboards report.
Specific figures from these dashboards are confidential and shared with partners under NDA.
Dashboards are a product: if a screen does not change a decision, delete it.
The hardest part is not the pipeline but agreeing on definitions and sticking to them.
Real-time matters most in the first two weeks of a launch; after that, weekly rigor beats hourly noise.
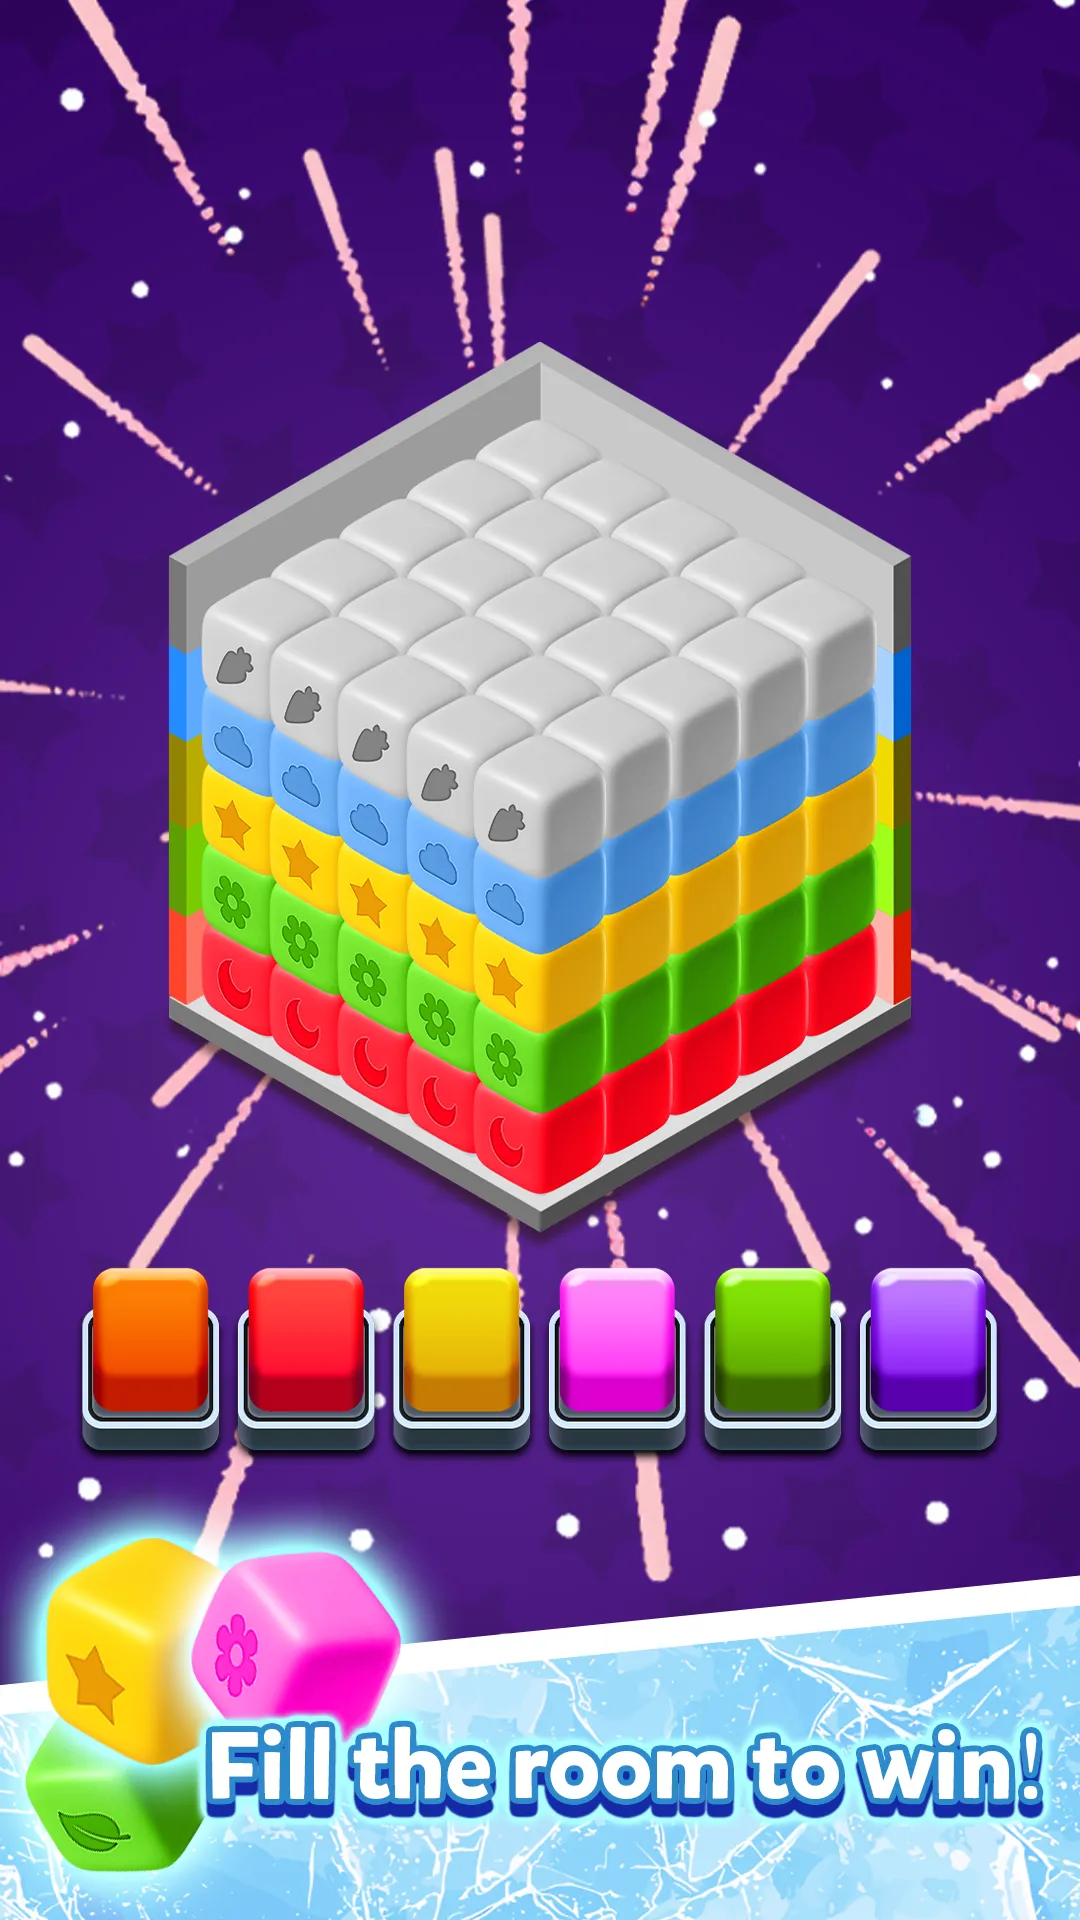
Cube Tidy: Sort & Fill
Sort Puzzle
Move and sort colored blocks to complete the tower layer by layer — a tidy, satisfying block-sort puzzle.
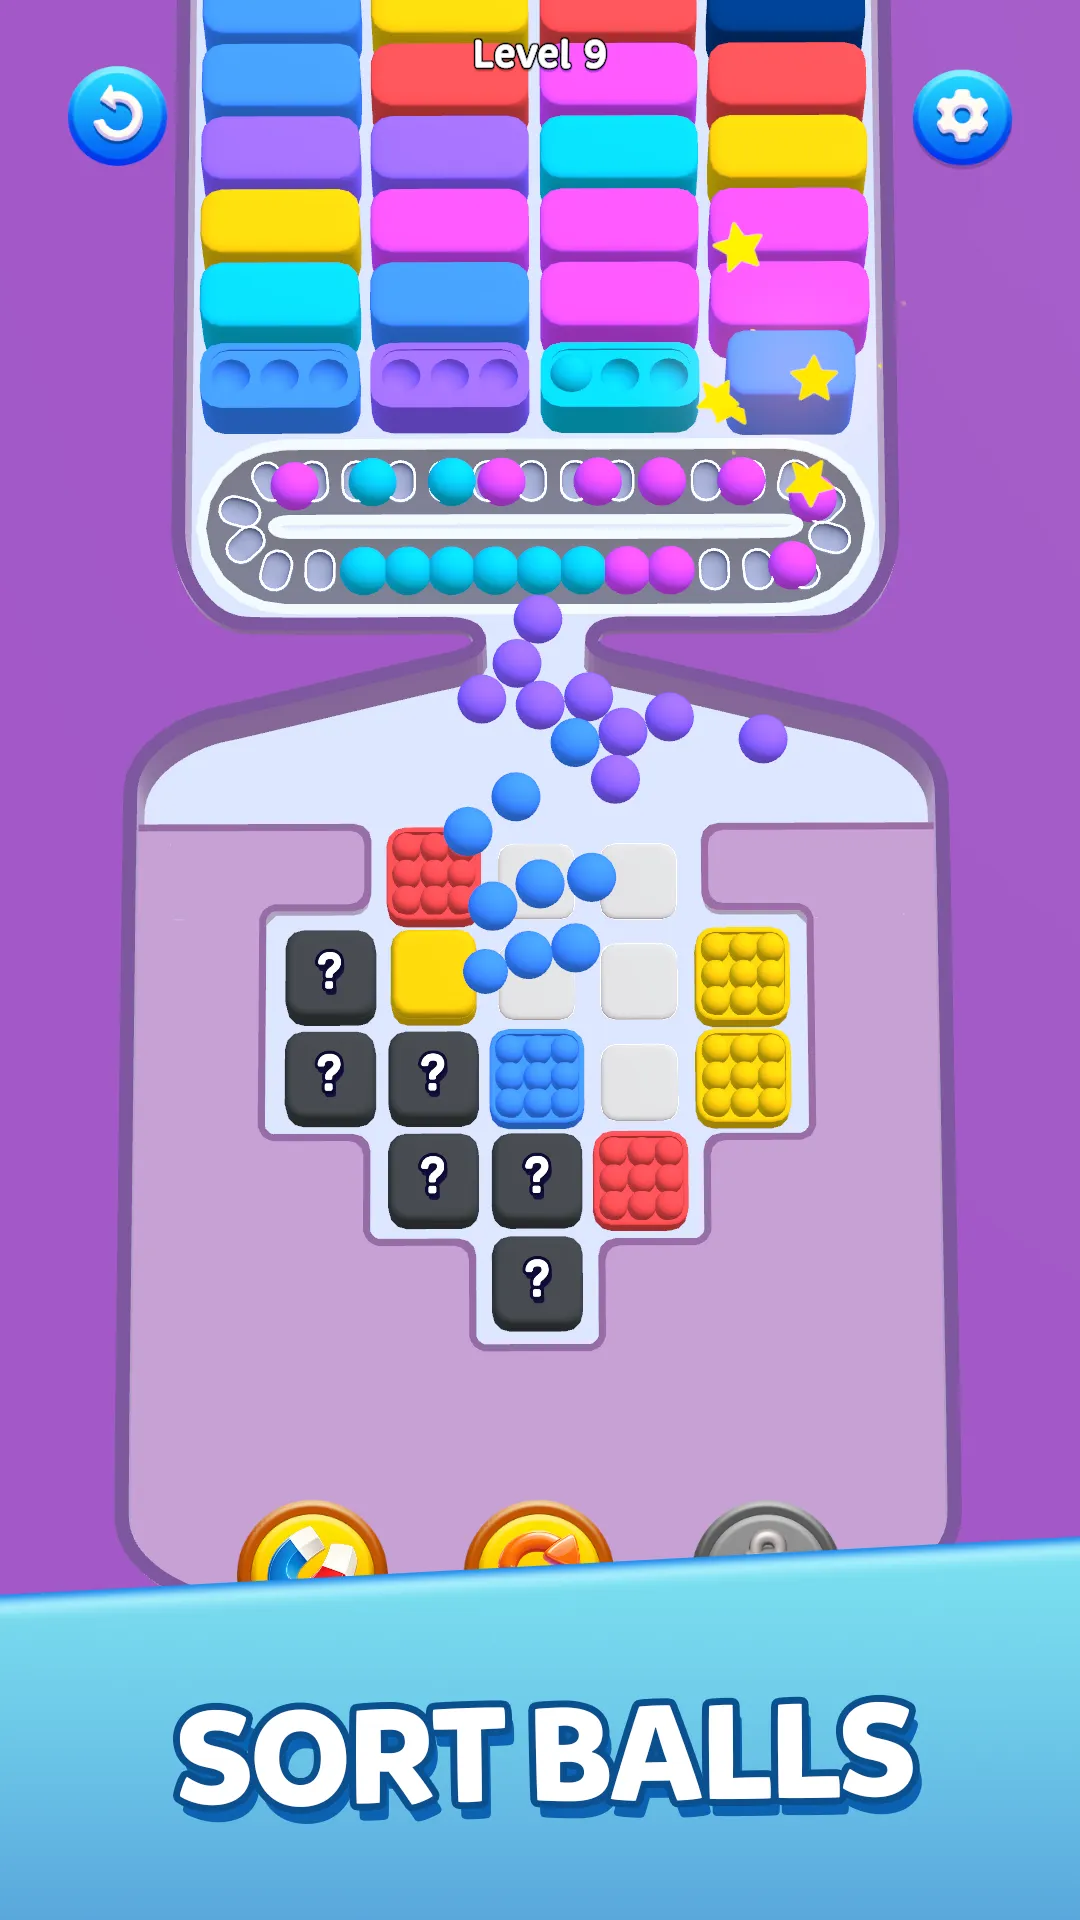

Marble Away!
Conveyor Sort
Tap marbles from the tray onto the conveyor and let them roll into matching groups — fast, tactile and oddly relaxing.

Deciding which prototypes deserve more investment is the most expensive decision a studio makes. The decision framework we use: thresholds agreed upfront, a small set of metrics, and three outcomes — go, iterate, kill.
4 min read
D1 tells you whether the first session worked. D7 tells you whether you have a game. Here is what we have found moves seven-day retention in mobile puzzle titles — and what mostly does not.
5 min read
Publishers and investors can request detailed KPIs for any title.